Decoding HR KPIs: A Practical Guide to Core Analytics Metrics

Decoding HR KPIs: A Practical Guide to Core Analytics Metrics

In 2025, human resource leaders must demonstrate their value with hard data instead of stories. Board decks now feature turnover curves next to revenue charts, and line managers expect on-demand head-count forecasts that look more like a Bloomberg terminal than a personnel file. The common thread? Key performance indicators—those carefully chosen metrics that distill oceans of HR data into crisp signals you can act on. 

Yet with hundreds of potential datapoints, from cost-per-hire to learning-hours-per-FTE, how do you decide which ones matter? This how-to guide demystifies the core HR KPIs, shows you how to calculate them without needing a Ph.D. in data analysis, and explains how modern people analytics solutions such as those offered by PeopleInsight by HireRoad transform raw numbers into workforce strategy.

KPI abstract illustration

Why KPIs Trump Gut Instinct

Great HR leadership blends empathy with evidence. Empathy keeps culture alive; evidence secures budget, automates decisions, and earns a seat at the strategy table. KPIs serve three critical roles:

1

Alignment – They anchor HR priorities to broader business objectives. When the CFO fixates on margin, measuring “regrettable attrition cost” turns people risk into a recognizable number.

2

Focus – Out of 300 potential HR metrics, KPIs highlight the ten or twelve that actually change outcomes.

3

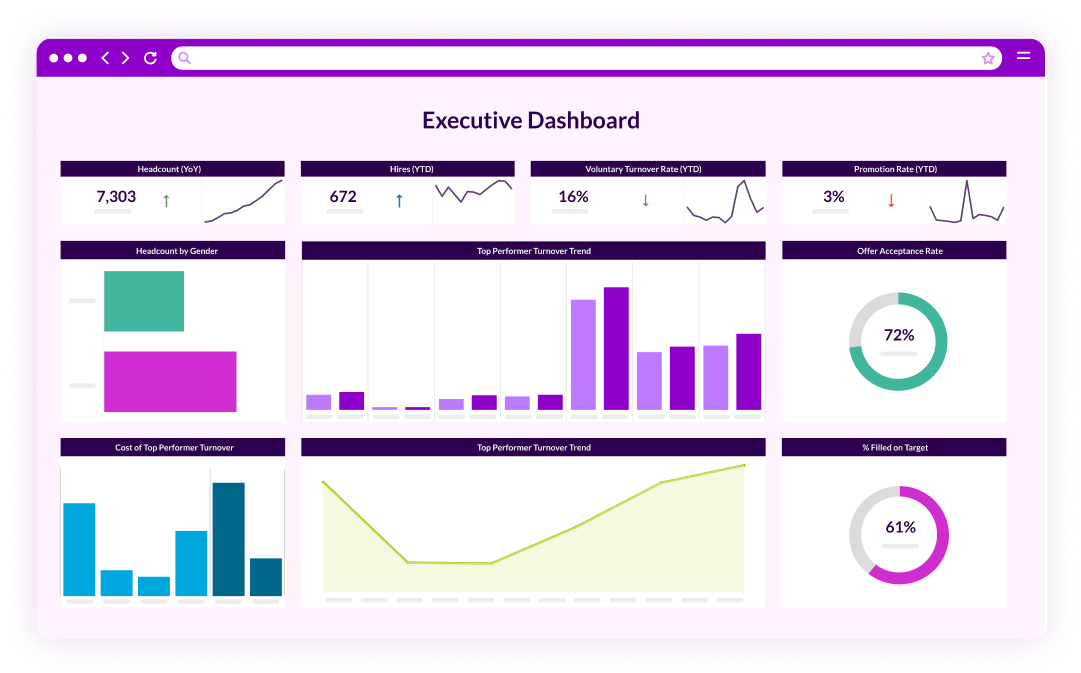
Velocity – Real-time KPI dashboards enable workforce analytics by letting managers course-correct sprint by sprint rather than quarter by quarter.

Bottom line: measured things improve faster than monitored feelings.

The Anatomy of a Good HR KPI

Not every data point deserves KPI status. A robust indicator is:

Frame 1321318103

Strategic. Directly influences revenue, risk, or cost.

Frame 1321318103

Controllable. HR or business partners can realistically move the needle within a planning cycle.

Frame 1321318103

Consistent. Uses stable definitions across geographies and time periods.

Frame 1321318103

Timely. Updates quickly enough to guide operational decisions.

Frame 1321318103

Explainable. Leaders understand what drives it and how to fix it.

Stick to this checklist and you’ll avoid “vanity metrics” that look impressive yet inspire no action.

Ten Core KPIs Every HR Team Should Track

01

Voluntary Turnover Rate

What it tells you: The share of employees who choose to leave in a given period.

Formula: Voluntary exits ÷ average head count × 100.

Why it matters: Exiting high performers drains institutional knowledge, spikes replacement cost, and can disrupt client relationships. In talent analytics models, even a one-point uptick in voluntary turnover can foreshadow productivity dips months later.

02

Regrettable Attrition Cost

What it tells you: The direct and indirect dollars lost when coveted talent departs—recruiting fees, ramp-up time, lost revenue, and team disruption.

How to use: Pair this KPI with engagement survey data to pinpoint high-risk cohorts.

PeopleInsight surfaces “heat maps” where cost meets sentiment, helping HR intervene before exits occur.

03

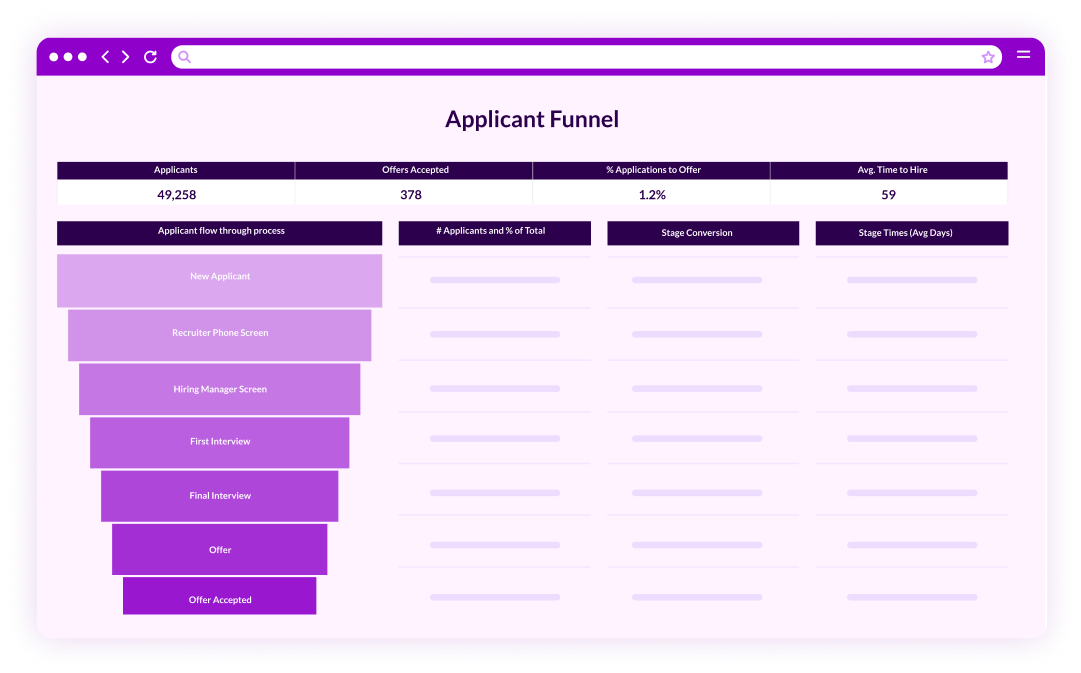
Time-to-Fill & Time-to-Start

What they tell you: Efficiency of the hiring funnel. Time-to-fill is days from requisition approval to offer acceptance; time-to-start measures onboarding lag.

Why they matter: Prolonged vacancies stress existing teams and delay revenue delivery. In agile environments, cutting these times by 10 % frees capacity for new projects without adding head count.

04

Quality-of-Hire Index

What it tells you: Post-hire success, typically gauged by first-year performance ratings, retention, and cultural fit scores.

Data sources: Performance management tools, engagement surveys, and retention logs integrated through HR software like PeopleInsight by HireRoad.

Action trigger: Declining QoH often signals misaligned sourcing channels or rushed interviews.

07

Internal Mobility Rate

What it tells you: The percentage of open roles filled by current employees.

Why it matters: High mobility boosts engagement and lowers recruiting costs. PeopleInsight dashboards combine LMS completion data with career-path frameworks to highlight untapped internal candidates.

08

Learning Agility Score

What it tells you: Composite metric weighing course completions, skill-assessment deltas, and application on the job.

Links to strategy: Companies with high learning agility adapt faster during tech shifts or market pivots. This KPI fuels workforce planning tools by predicting which teams can absorb new responsibilities without external hires.

05

Managerial Effectiveness Index

What it tells you: An aggregate of team engagement, turnover, and performance—rolled up to each supervisor.

How to act: Use it to aim leadership-development resources where impact is highest. Dropping below a benchmark threshold should trigger coach-led interventions.

06

Total Rewards Competitiveness Ratio

What it tells you: How your compensation and benefits stack against market medians for similar roles.

Tools involved: Compensation surveys blended with payroll extracts in your people analytics software. Seasoned teams layer cost-of-living indices for geo-adjusted views.

09

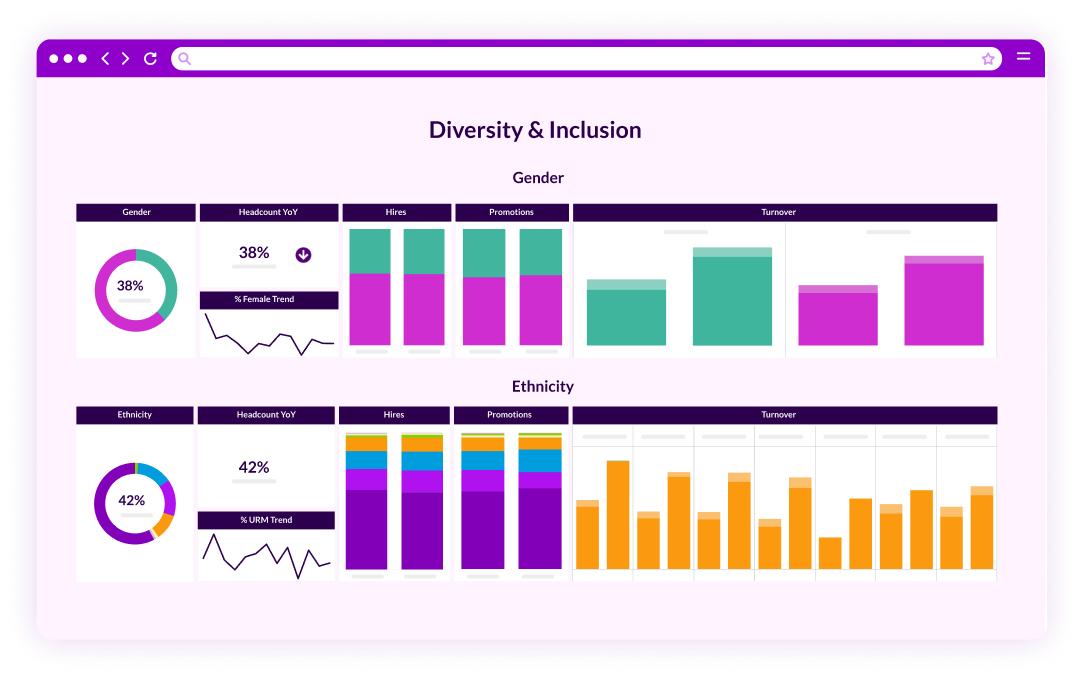
Diversity Representation Gap

What it tells you: How demographic representation at each level diverges from available labor-market pools.

Action link: Managers receive head-count forecasts flagged with diversity impact scores, enabling proactive sourcing from underrepresented pipelines.

10

Employee Net Promoter Score (eNPS)

What it tells you: Workforce advocacy, how likely employees are to recommend the company.

Why it matters: eNPS predicts turnover spikes and brand health. Marry it with social-listening data inside your people analytics solutions to gauge public employer reputation in real time.

Moving from Metrics to Momentum

Collecting KPIs is easy; converting them into better decisions is the hard part. Follow these five practices:

check mark (4) 1

Centralize Your Data. Feed payroll, ATS, LMS, and survey streams into a single model. Silos sabotage credibility.

check mark (4) 1

Automate the Math. Remove Excel handoffs by letting people analytics software regenerate KPIs nightly. Your analysts should interpret, not tabulate.

check mark (4) 1

Embed Alerts. Push KPI deviations into collaboration tools—Slack, Teams, email—so frontline leaders act within hours, not weeks.

check mark (4) 1

Tell Stories with Context. A 14 % attrition number means little alone. Pair it with exit-interview sentiment or hot-skill salary inflation for narrative punch.

check mark (4) 1

Close the Feedback Loop. Every corrective action should feed back into the dataset. Did offering remote work reduce attrition? Your dashboard should show the delta next cycle.

This cycle of measure → interpret → act → learn is the essence of workforce analytics for agile teams.

One Platform, Many Possibilities

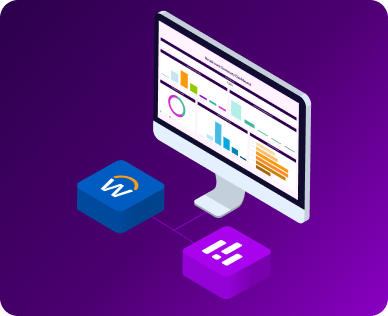
Disconnected spreadsheets can’t support this virtuous loop. PeopleInsight by HireRoad’s software unifies HRIS feeds, engagement scores, learning paths, and labor-market benchmarks into a flexible schema ready for both canned dashboards and custom explorations. Out-of-the-box widgets cover every KPI above, while open APIs let you bolt on niche apps—comp surveys, psychometric tests, or shift scheduling—without losing data lineage.

Leaders love the conversational query tool: ask “Which departments have a high learning-agility score yet low internal mobility?” and get a ranked table plus a recommended action pack. Analysts appreciate the sandbox where they can clone models, tweak weightings, and compare “what-if” forecasts. Most importantly, business partners see live KPI cards right inside their workflow apps, transforming abstract HR metrics into just-in-time decisions.

Launching Your KPI Program in 90 Days

Days 1–30: Assess & Align

arrowright

Meet with executives to tie desired outcomes (growth, innovation, cost control) to HR realities.

arrowright
Audit data sources and check quality—duplicate IDs, mixed date formats, missing demographic fields.

Days 31–60: Prototype & Validate

arrowright

Spin up a PeopleInsight sandbox.

arrowright

Load historical data to calculate two or three high-impact KPIs—perhaps voluntary turnover, time-to-fill, and quality-of-hire.

arrowright
Review with stakeholders. Refine formulas and thresholds until everyone trusts the numbers.

Days 61–90: Automate & Activate

arrowright

Establish secure data pipelines for nightly refresh.

arrowright

Embed KPI widgets in managers’ dashboards.

arrowright

Train leaders on interpreting trends and setting quarterly goals tied to each metric.

By the end of quarter one you’ll have a functioning KPI engine that supports rapid decision-making—and a roadmap for scaling into advanced predictive models.

Avoiding Common Pitfalls

pitfall icon

Analysis Paralysis: Resist the urge to track every metric imaginable. Start small, expand only when insights drive action.

pitfall icon

Glossy Dashboards, No Workflow: If alerts exist solely in a web portal nobody checks, they’ll gather dust. Integrate with daily systems.

pitfall icon

Data-Privacy Oversights: Anonymize sensitive information and apply least-privilege access controls. Compliance fines dwarf any analytic value.

pitfall icon

One-and-Done Mentality: Revisit KPI relevance twice a year. As strategy shifts—perhaps from expansion to margin protection—your metric mix should evolve.

The Strategic Payoff

When KPIs are clean, timely, and actionable, HR transforms from a cost center into a strategic accelerator. Talent risks surface before they derail projects; learning investments target tomorrow’s skill gaps; diversity goals shift from annual audits to weekly progress charts. With data leading the conversation, budget approvals become simpler, stock-price fluctuations feel less fraught, and leadership debates revolve around solutions rather than hunches.

Modern people analytics solutions make that future attainable. They strip away data wrangling, overlay smart visualizations, and nudge managers toward behaviors that elevate performance and engagement alike. Whether you’re a 300-person scale-up or a 30,000-employee enterprise, the journey starts by selecting KPIs that matter and trusting the tech to keep them current.

Ready to turn these KPIs into everyday wins? Book a free personalized demo with PeopleInsight by HireRoad today to see how PeopleInsight blends intuitive dashboards, flexible modeling, and automated alerts. Giving you the clarity to act, the confidence to persuade, and the agility to lead. Your workforce is already generating the data; let’s transform it into a strategic advantage.