Executing your HR Analytics Project – In 8 Steps

In this blog we look at our 8-step plan for getting started once you’ve identified your first HR Analytics project – that juicy business opportunity. Follow these steps and you’ll be sure to deliver business value through your analytics and reporting.

Here’s an overview of the steps.

  1. Read and understand your business plans
  2. Scope out your DDHR (data-driven HR) project
  3. Define your primary metric
  4. Define your secondary and supporting metrics
  5. Articulate the ‘What’
  6. Articulate the ‘Why’ behind the ‘What’
  7. Drive Decisions, Case for Change, Targets and Change Plans
  8. Implement, Measure Success, Stabilize and Realize Value

1) Read and Understand Your Business Plans

It may seem obvious… but… have you read your most up-to-date corporate business plan or objectives? If you don’t have access to it or don’t have one, have you interviewed members of your executive team to understand the overall direction?

If you haven’t, how will you be able to build people and organizational capabilities?

HR becoming data-driven is about achieving better balance with your qualitative and quantitative data (i.e. gut feel and hard facts). This balanced approach needs to be applied within the context of something relevant, juicy and purposeful for the organization – whether that is a specific Line of Business (LoB) that you serve, or a larger corporate objective.

HR must understand the Corporate and Business Unit Plans, understand what this means in terms of people programs and capabilities, and must identify, scope, and deliver Data-Driven HR projects which will help you achieve these business plan outcomes.

2) Scope Out Your Chosen DDHR (data-driven HR) Project

Your scoping exercise should include these activities:

  • Read Your Corporate Business Plan
  • Read Your Line of Business Unit Plan (the plan for your direct client)
  • Discuss and “play-back” your key observations to the management team/LoB to ensure you’ve created sufficient understanding
  • Ensure and articulate how your first DDHR Project supports Key Areas of Focus for your client (these could be from the Corporate objectives, LoB objectives, or a combination)
  • For your first DDHR Project, research, brainstorm and document the following – to the best of your ability:
  • The specific objectives, outcomes and metrics related to the project
  • The people and organizational requirements/capabilities for delivering on this
  • Your gaps when it comes to all aspects of HR & people programs (i.e. if you need to “improve close rates in our Sales Team” and you don’t have a best practice Sales Closing Training Course available, then this would be considered a “gap“)
  • The risk, implications and business impacts of not closing that gap
  • Brief your LoB Lead/management team on your findings from the above activities – gain deeper understanding, alignment and support for your project. If you’ve got it right, you should have raised the enthusiasm and interest of your clients.

Now you’ve put some boundaries around your ONE Data-Driven HR Project and understood it in greater detail with your organizational or LoB counterparts – you must now define the project in more detail – and execute. There are several steps to this – steps that dig into the data and metrics you’re going to capture.

3) Define Your Primary Metric

You need to define something we call a Primary Metric which captures the essence of what your project is focused on accomplishing. When defining the Primary Metric, it’s advised to be as specific, and detailed as possible – as this is the foundation of all subsequent steps.

You may however decide, at this point in time, to keep this directional in nature (i.e. decrease or increase) and not get into specific targets. This is all good. Targets can be estimated/set in a subsequent stage when you have access to hard data.

Here’s an example:

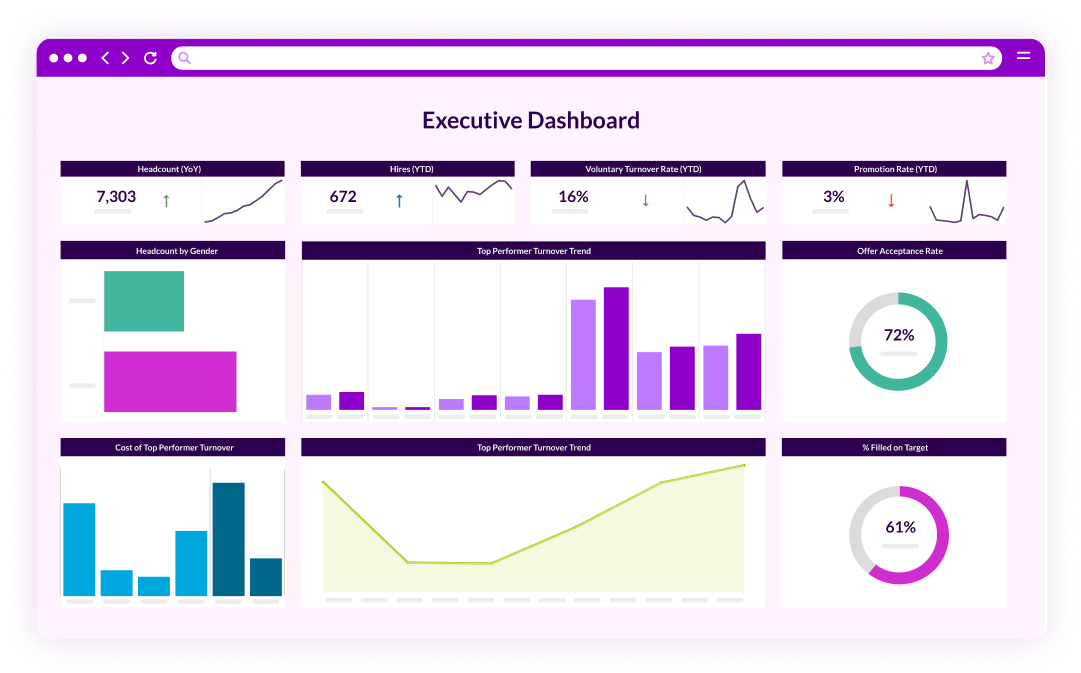
  • “Decrease Turnover of our Top Performers (Rated Outstanding and Exceptional) in their First Year of Tenure in the Sales Department”

Ensure you define the nuances of your Metric such as… Do you mean First Year in the company, or First Year in Sales? Do you count a top performing employee who spent 3 years in Marketing, then transferred to Sales and then left the company 9 months into their Sales role?

Quantify (state the current facts regarding) your Primary Metric in terms of both rate and magnitude:

  • In 2019 our Top Performer Turnover Rate for those employees in their First Year of Tenure in the Sales Department was 23%
  • In 2019, this represented 17 EEs departing on a total segment of 77 EEs

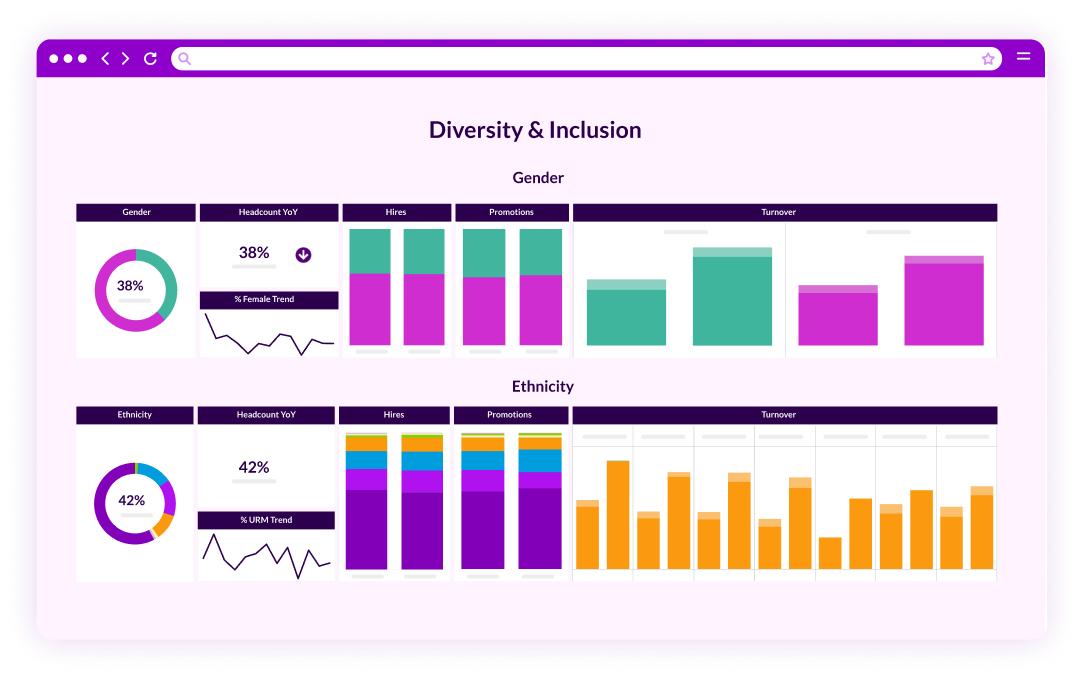
To achieve a comprehensive understanding, your Primary Metric needs to be looked at from many lenses – this means slicing and dicing your data across the data dimensions which are available to you. If you are fortunate to have powerful workforce analytics or BI tools, this will be simple. If you are calculating in a spreadsheet, this will be more challenging so be prepared to dig in and spend some serious time on this.
4) Define Your Secondary or Supporting Metrics

Your Secondary or Supporting Metrics are the additional data dimensions and segmentation which may be important to your analysis. The extent of these Secondary Metrics and segmentation is really up to you – but in our experience, this is where the most insightful observations and story lines can come from.

For example: Segment and slice your data so you can understand if there are any anomalies based on demographics, location, manager, manager’s attendance at a People Manager training course, recruitment channel, onboarding survey results and engagement, among other things.

You’re only limited by the data you have access to and your ability to connect it. Again, if you’re working with a people analytics partner or use a powerful BI tool this will be relatively easy. If you don’t and you’re dealing with spreadsheets and disconnected systems, roll up your sleeves and tuck in… you’ll need time and some analytics expertise on your side.

5) Make Quantitative Observations – Articulate “The What”

Using your Secondary Metrics, continue segmenting and analyzing your data, making observations focused on anomalies (outliers in your data, hot spots where acceptable thresholds are exceeded, or where the sheer mass/magnitude of an issue can represent an opportunity, or lack thereof).

6) Articulate “The Why Behind The What”

At this point, you’ll have a collection of facts compiled about Top Performer Turnover in Sales, for employees in their First Year of Tenure.

Armed with this multidimensional and segmented analysis, you must dig deeper into the story lines, understand the context in which they occurred, and ask “why” to those who are best positioned to articulate logical reasons and hypotheses.

This is qualitative understanding.

This can be accomplished through a variety of techniques. For example, you may choose to run some focus groups with other Top Performers in Sales, those who are in their second year of tenure who can shed some light on the experience, you may want to implement or harvest data from your Onboarding Experience Survey, you may want to have small group conference calls, 1 on 1’s or water cooler/off the record conversations with Managers, etc. Whatever the approach, this is focused on getting to the lived experiences of those involved, bringing the numbers to life and providing the context.

The objective here is to spend some time digging deep so you can balance your facts with context, and be prepared to tell the story in a more complete fashion, with as much texture as possible.

7) Drive Decisions, Case for Change, Targets and Change Plans

In our opinion, it’s futile and pointless to embark on Step 1 of this process unless you are willing to drive a decision, and implement change.

GUT CHECK: If you don’t expect your data-driven HR efforts to drive decisions and change, then seriously think about stopping now and focusing on something that the business, or your HR team, would value.

Decision making must be done in collaboration, consultation and with the support of your LoB client. It’s therefore critical, that you’ve been engaging with your LoB clients throughout the prior steps – and have access to the facts, context and opinion.

Decision making for the Line of Business is all about Return on Investment (ROI) – which requires the development of a Case for Change. Some might call this a Pitch Deck, others a Business Case. Regardless, the Case for Change is a 10-15 slide summary and recommendation which is structured as follows:

  • Executive Summary
  • Background and Context
  • Current Environment/Issue Identification (Facts andContext)
  • The Opportunity
  • Proposed Solution(s) and Targeted Outcomes
  • Costs and Benefits (ROI)
  • Project/Implementation Approach
  • Resources Required
  • Recommendation
  • Next Steps

The goal is to convince your stakeholders and impacted partners that change is needed and helps them accomplish their goals.

8) Implement Change Plans, Stabilize, Measure Success and Realize Value

For more information on how to implement and create sustainable change, please refer to Playbook 4 where we go deep on this topic.

Remarkably, “Business Case Realization” is incredibly easy to ignore – in fact, we are often systematically forced to move onto the next activity before we have captured results – and metaphorically “banked the winnings”.

You must try and avoid this pitfall at all costs:

  • Remember, the only reason why you’ve been trusted to invest in data-driven HR is to chase juicy business outcomes.
    You’ve sold this initiative on a business case – so you must spend some time quantifying and counting your accomplishments and success – and sharing that with those that matter.
  • Simply determine the ROI of your initiative
  • On one side of the ROI equation you will articulate the “New Value” you have created through this initiative.
  • On the other side of the equation, articulate the Cost of the initiative (days effort in working this project can be converted to a daily internal loaded cost rate). You will use this as your denominator.
  • Subtract the Cost from the New Value and call the result your “Net New Value” – use this as your numerator.
  • Divide the Net New Value by Cost and multiply by 100.
  • You now have your Return on Investment for this data-driven HR project.

Given This Is A Largely Untapped Area – The Benefit Pools Can Be Spectacular

Here’s an example from a technology client of ours at HireRoad:

  • The turnover of one specific Key Technical Role decreased by 25% in the first year after implementing analytics tools which gave managers deep visibility into their turnover – enabling them to segment on-the-fly.
  • The VPHR directly attributed the impacts to having increased visibility.
  • This resulted in a cost avoidance of approximately $750k for this year.
  • The cost of investment was less than $25k.
  • The Net New Value is $750k-$25k = $725k
  • The ROI of this investment in data-driven HR was: ($725k divided by $25k) x 100 = 2,900%
  • Yes, 2,900%

Once you’ve realized the value, you must communicate it and celebrate it. Then learn from it and build on it. Keep the momentum up with your next HR Analytics project. Want to see how we can help?