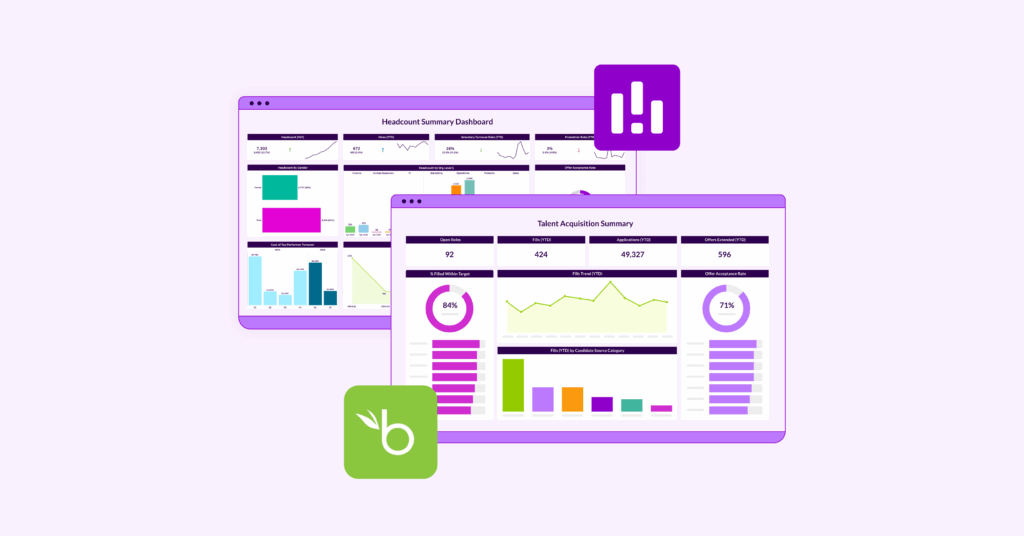
BambooHR + PeopleInsight by HireRoad: Advanced People Analytics for Mid-Sized Teams Without the Heavy Lift
BambooHR has become a go-to HR system for growing and mid-sized organizations because it’s approachable, modular, and covers the full employee journey, core HR data, applicant tracking, onboarding, payroll, time, benefits, performance, and employee experience features. That breadth, along with an integration marketplace, makes it easy to centralize your people operations.
As your HR tech stack grows, you’ll need a way to connect BambooHR data with recruiting, learning, finance, engagement, and service desk systems in order to get a clear, comprehensive view of your workforce insights. PeopleInsight by HireRoad is built to do exactly that.
What BambooHR does well for the mid-market
BambooHR positions itself as a complete HR platform for small and mid-sized businesses, with connected modules and an integration-friendly approach. It’s particularly popular with teams that want fast adoption, clean UX, and the flexibility to add capabilities, like payroll or performance, when they’re ready.
A helpful fact about BambooHR’s data footprint: its Benchmarks product draws on aggregated, anonymized data from more than 34,000 companies and 3 million employees, which underscores the platform’s reach in the SMB and mid-market space. That scope makes its benchmark rates and trends particularly useful when you want to compare your metrics to peers.
But as soon as leaders start asking more complex business questions, like “Did the onboarding updates actually reduce 90-day attrition?” or “Are our hiring sources improving time to productivity?” HR teams realize they need to blend BambooHR data with other sources (ATS, learning, surveys, performance, and finance) in order to get answers. Native BambooHR reports are essential for day-to-day operations, but they’re not designed to cleanse, harmonize, and visualize multi-system data with consistent definitions across departments and quarters.
Moving from Dashboards to Advanced Insights
As companies mature, the questions get more layered and time-based. Leaders want to know which hiring sources improve 90-day retention, whether overtime spikes cluster in certain shifts and locations, and how compensation changes affect progression and pay equity over time. BambooHR supplies the ingredients for these answers: requisitions and candidate stages from the ATS, start dates and job changes from core HR, time and PTO records, pay elements, and organizational data such as departments, locations, and job families. The strength of the platform here is consistency, which lets teams explore trends without reinventing definitions every quarter.
BambooHR’s ecosystem matters as much as its core. Through its marketplace and APIs, BambooHR connects with tools for background screening, learning, surveys, scheduling, and financial planning. That connectivity reduces manual exports and spreadsheet stitching, so it’s practical to look across modules and spot patterns. Advanced reporting with BambooHR and its partners can include:
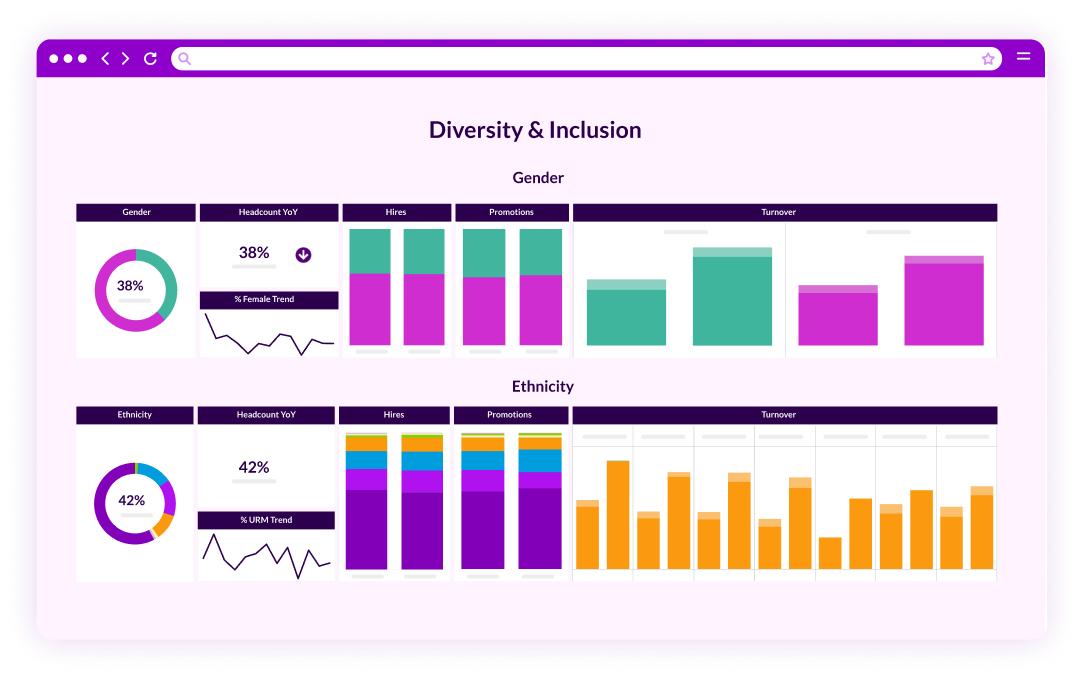
Join recruiting and start data
Connect stage progression and source tags to first-year outcomes captured in HR and payroll.
View time, absence, and pay together
Compare missed shifts, PTO, and overtime by department and manager, then add tenure bands to highlight risk patterns.
Track compensation trends over time
Monitor compa-ratios, off-cycle adjustments, and promotion velocity by job family to surface compression and inequities before review cycles.
Visualize workforce flows
See lateral moves, promotions, and exits by location and business unit to identify healthy pipelines and bottlenecks.
The hurdle is rarely access; it’s time and consistency. Even with clean exports, analysts still need to align fields when definitions evolve (for example, renamed cost centers or updated job families). They also need repeatable views that hold up month after month and a clear narrative that busy executives can act on without living inside a reporting tool.
That’s why many teams look to integrate an analytics layer on top of BambooHR. The goal isn’t to replace what BambooHR does well; it’s to get from “what happened” to “why it happened” and “what to do next,” without building a custom BI stack or relying on one-off spreadsheets that drift from the truth.
What better use of BambooHR data looks like with people analytics
Cleaner, comparable dimensions
Keep departments, locations, job families, and cost centers aligned across time and any connected systems so trend lines don’t break when structures change.
Consistent metric definitions
Lock in how you calculate time-to-fill, early-tenure attrition, overtime ratio, and compa-ratio so conversations focus on actions rather than math.
Role-based views
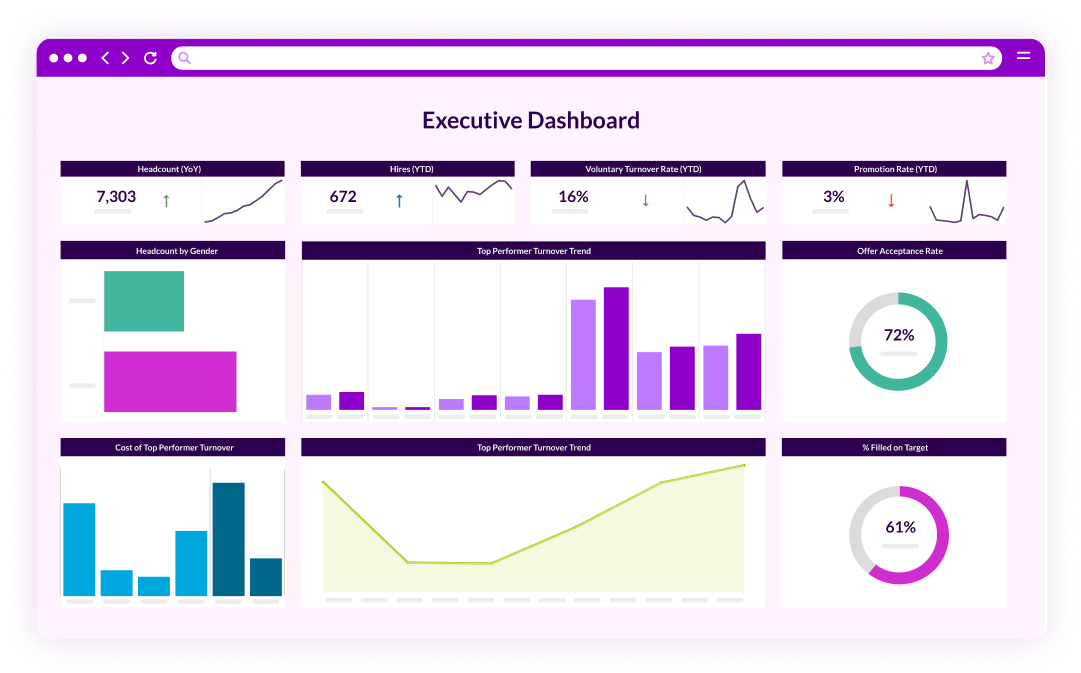
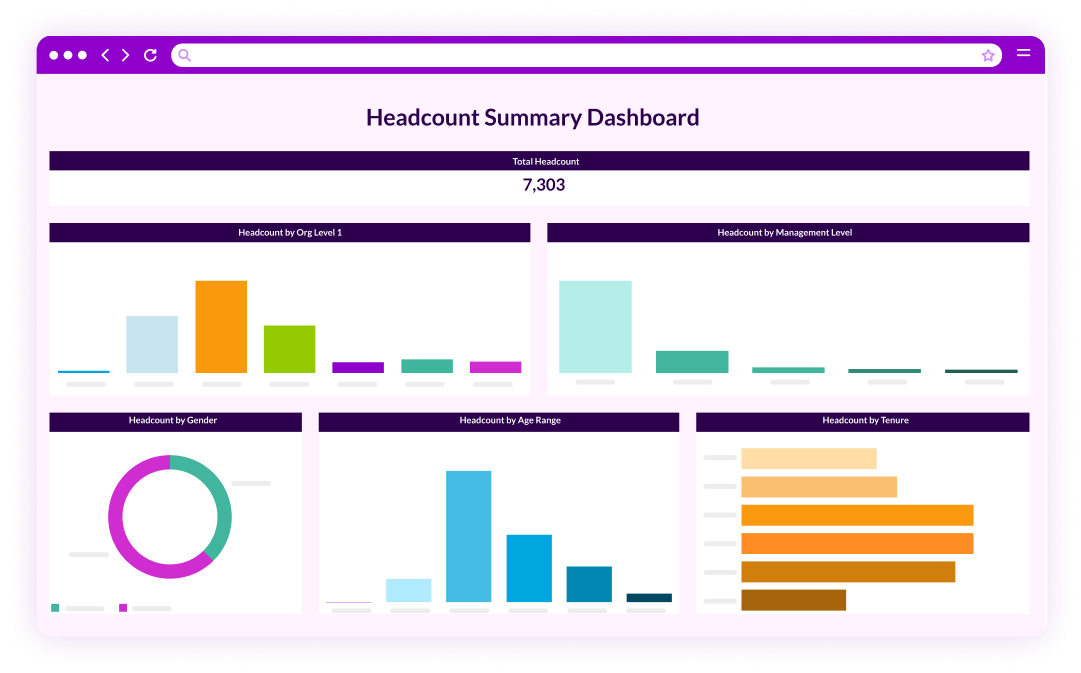
Give executives concise scorecards, HR business partners diagnostic drill-downs, and managers simple task lists tied to their teams.
Narrative-ready visuals
Give executives concise scorecards, HR business partners diagnostic drill-downs, and managers simple task lists tied to their teams.
How people analytics complements what’s already in BambooHR
BambooHR’s native reports are ideal for daily operations. An analytics layer sits above that and helps answer cross-tool questions by combining BambooHR data with, for example, applicant sources from an external ATS, shift schedules from timekeeping, or budget context from finance:
Hiring quality and retention
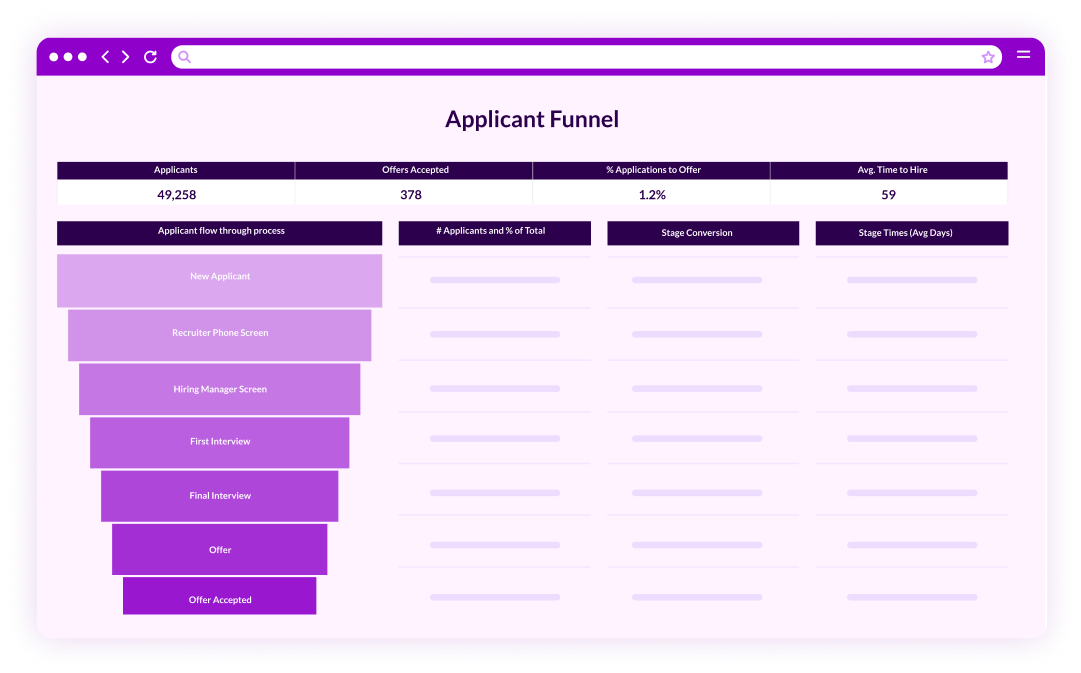
Relate candidate source and assessment data to six- and twelve-month retention and performance proxies, then shift budgets toward higher-yield channels.
Onboarding and time-to-productivity
Measure how onboarding steps affect time-to-proficiency and early-tenure turnover by department and location.
Pay, equity, and progression
Compare pay against bands and progression velocity across cohorts to spot compression and structural inequities early.
Absence patterns and cost
Tie absence and overtime spikes to service levels or SLA breaches to make the labor-cost case for staffing changes.
You can answer parts of these questions within ADP. But you can’t fully answer them without joining ADP data with data from the rest of your HR Technology stack and doing so reliably, repeatably, and in a way that stakeholders understand at a glance.
For mid-sized teams with lean analytics capacity
If you’re running HR with limited or no analytics resources, the difference between reactive monthly “data firefighting” and consistent, actionable storytelling is having a lightweight, reliable way to model and analyze data, maintain definitions, and publish dashboards that people actually use. BambooHR provides the steady operational data and their marketplace connections that make this possible.
Why workforce insights are more critical now, than ever
Mid-market HR is being asked to deliver enterprise-grade reporting with fewer resources. Analytics on top of BambooHR turn its HR backbone and Benchmarks, built from anonymized data across 34,000+ companies and 3M employees, into quick, self-serve answers. Lean teams stop chasing ad-hoc reports and instead show trends and ROI in minutes, put metrics in market context, and earn a real seat at the table.
Where PeopleInsight by HireRoad fits (the last step)
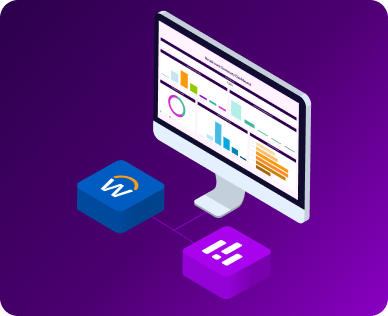
When you’re ready to add an analytics layer without launching a complex BI implementation or adding headcount to your team, PeopleInsight by HireRoad easily plugs into BambooHR and the rest of your stack, harmonizes dimensions and metric definitions, and publishes role-based dashboards that answer the cross module questions leaders care about – delivered in just 5 days. You continue to run HR in BambooHR; the analytics layer turns that data into decision-ready narratives for HR, Finance, and Operations.
If you’d like to see your BambooHR data presented this way, joined where it needs to be, cleaned for consistency, and explained in plain English, reach out to PeopleInsight by HireRoad or visit PeopleInsight in the BambooHR marketplace We’ll show how quickly you can move from siloed reports to confident, executive-ready decisions.