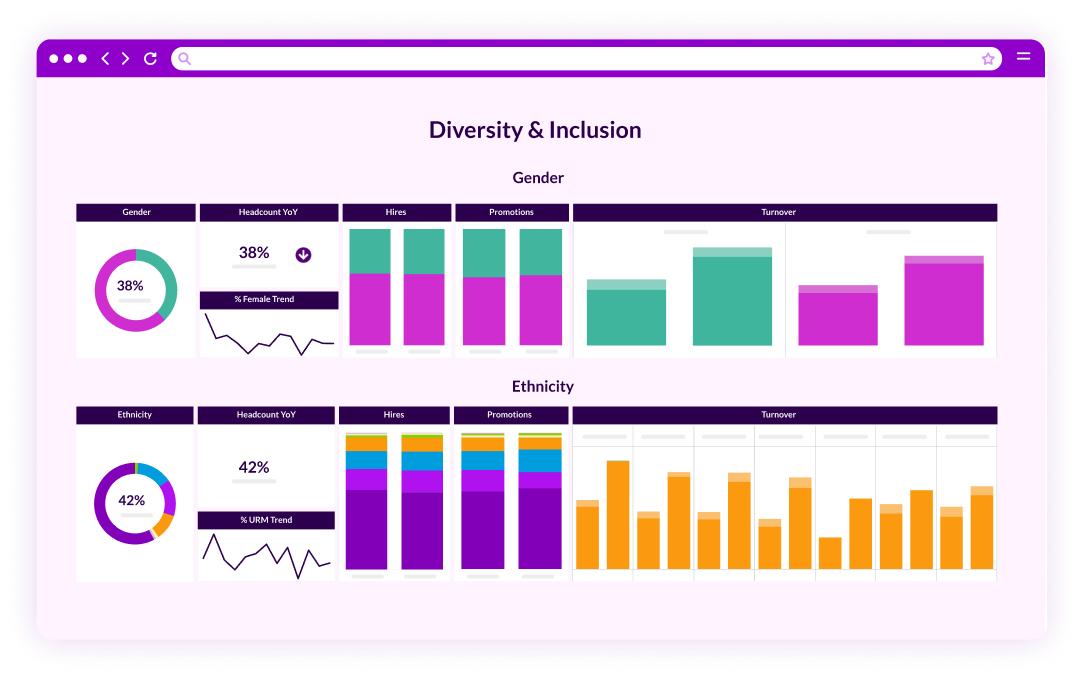
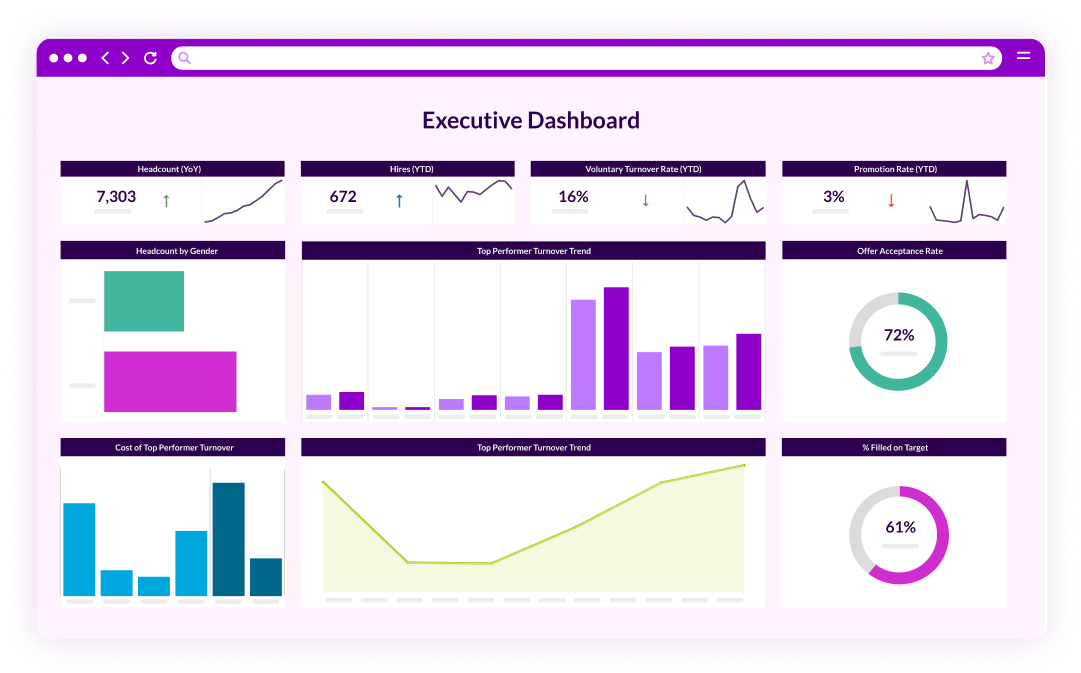
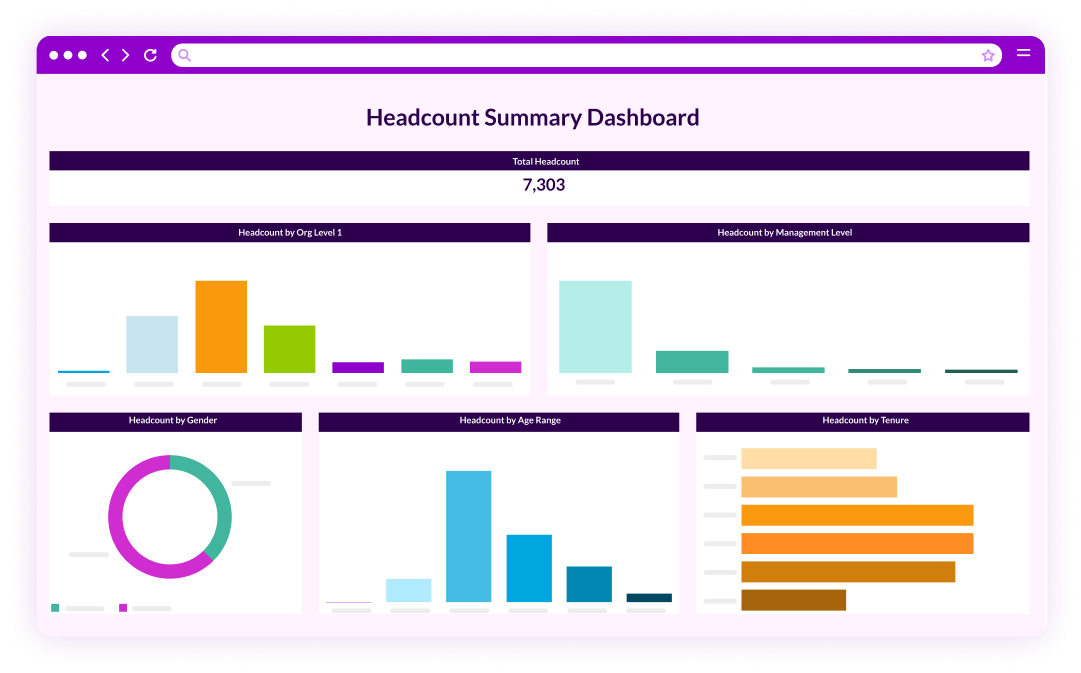
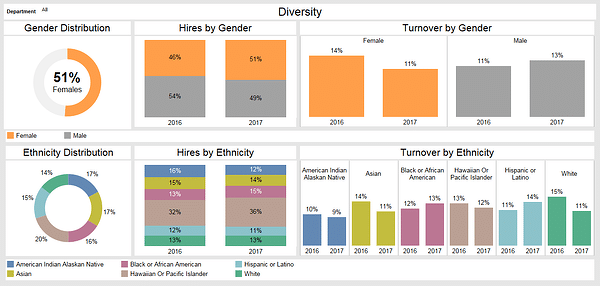
While your top line diversity and inclusion metrics can be many things — interesting, pride-inducing, or even downright disappointing — it’s what lies beneath the surface that is most important. And most actionable. Going beneath the surface means delving beyond legislative reporting requirements. It also means going beyond the capabilities of your HR system’s embedded reporting.
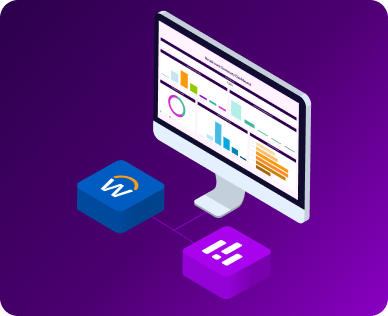
For this, you need to be able to perform segmentation, trend analysis, and have powerful filtering capabilities to discover your diversity and inclusion data across the dimensions that matter. And you can only do that in a business intelligence platform that connects data from multiple systems. And provides HR and diversity and inclusion reports, dashboards, scorecards, and analytics.
For instance, looking at disparate data points like:
- turnover for those in their parenting years, specifically women in management
- who have received continual promotion
- are part of a High Performance stream
can shed a lot of light into HR programs, benefits and the ongoing sentiment towards progressing with your company while balancing family and work life.
Another example, might be digging into compa-ratios and market-ratios by ethnicity. Add in some aspects of individual performance or performance outcome – and this will give you the facts.
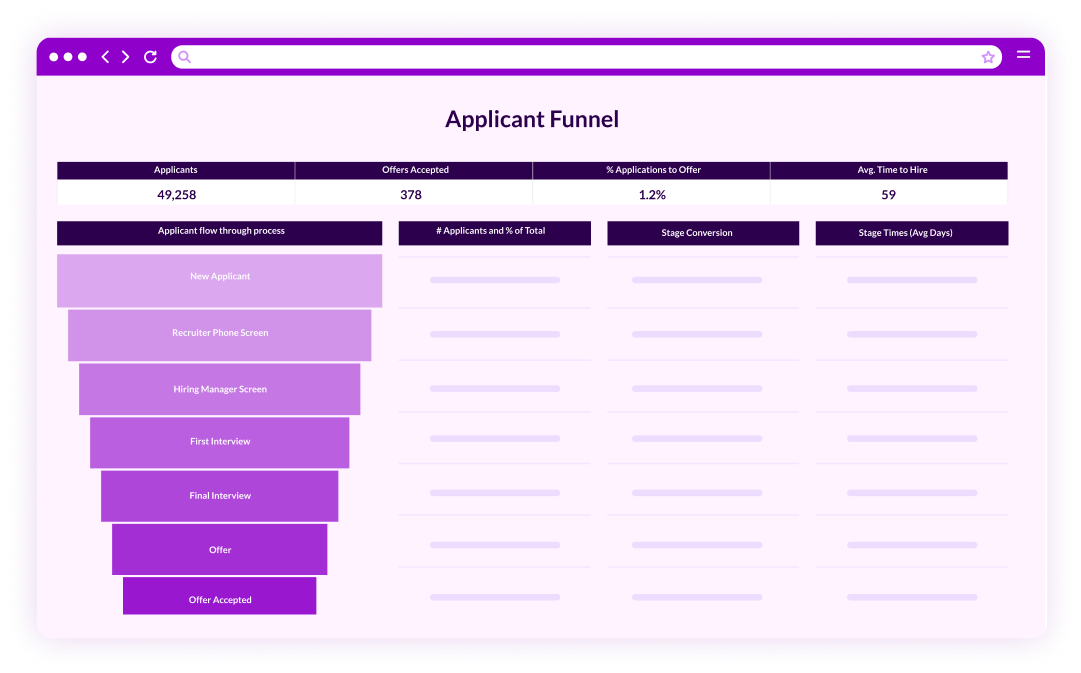
Lastly, how about connecting the dots between candidate diversity and equity data and your overall needs, plans and goals from an AA/EEO or DEI perspective? You need to know if your candidate pipeline is progressing you in the right direction.
This is only a brief introduction to what evidence-based HR data can do to improve your DEI. Interested in seeing Diversity, Inclusion and Compensation Analytics in action? Watch this short video below or request a demo.
