We’ve all been there – either as presenter or observer – at that moment in a presentation when a slide goes up and it’s full of rows and columns of numbers, and perhaps an xls generated graph or chart. And when this happens – when reporting on talent data consists of bland charts and repetitive graphs – you can pretty much count on one of two things transpiring:
- The air gets sucked out of the room and you feel the audience withdrawing, checking out, glazing over
- You sense an energy shift in the room and an atmosphere of challenging, rationalizations, judgements and defensiveness starts to emerge.
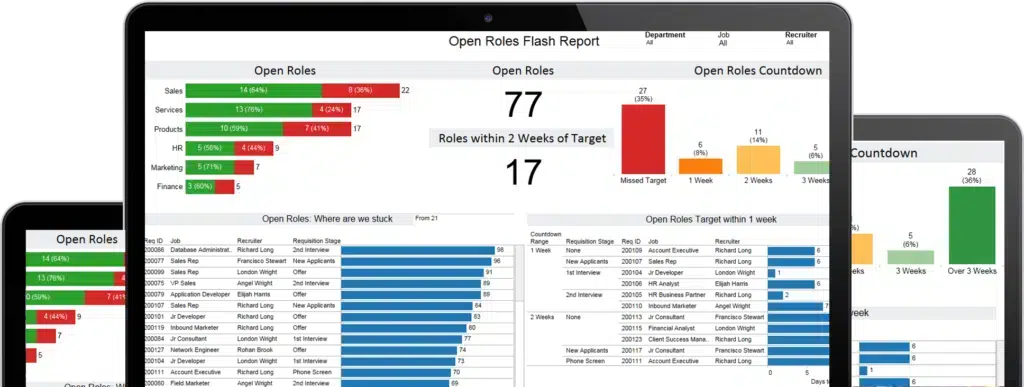
Of course, if things are really going your way, both happen – half your room is disengaged and the other has its back up. This can happen in your weekly or monthly Executive meeting where you are expected to report on people data – which may include measures of open requisitions, time to fill, cost of hire, quality of hire, and more. These reactions are not surprising. On the one hand, some people just cannot relate to flat numbers on a page or screen – some find them intimidating and others find them boring and uninspiring. Others approach data presented in this way with skepticism – they question, judge and look for flaws, and they often focus on the source or integrity of the data rather than what the data is saying. When you start with flat, grey data you effectively shut down higher brain functions, kill creative thinking and suppress emotional response in your audience. This certainly isn’t the outcome Talent groups are looking to achieve with Executives. We should be telling a compelling story about the people and the data, and making connections to business outcomes. We should be sharing insight, making a difference and impressing. Unfortunately, for many of us in HR and Talent, our level of insight and reporting style often hold us back. Imagine having comprehensive and integrated analytics at your fingertips. Imagine entering the Executive boardroom and presenting your Talent data and metrics through interactive visuals that go beyond the basics. Below we have examples of an Open Roles Flash Report and Candidate Pipeline Dashboard. With interactive analytics, it’s possible to drill down into any attribute and obtain a visual representation of the data that is easy to understand.
With analytics presented in this way, instead of tuning out, our data-averse colleagues are leaning forward, thinking, deciphering the story and the meanings embedded in the visualizations. Instead of attacking, our skeptics are working with us to figure out ways to move the dial or change red to green on the charts. And both groups end up asking for more. You’ve captured the attention and interest of the Executives. There is an emotional response to data visualizations that inspires curiosity, thought and action. Instead of just seeing the data we begin to feel it when it is presented in attractive, informative and insightful ways. Even if you are seeing what you already know, data visualizations provide the opportunity to feel it. Good visualizations evoke a response and trigger understanding that numbers in a chart simply cannot. In the above examples, we are drawn in and compelled to understand what we are seeing. Even more, once we understand what we are seeing, it begs the questions why, how come, and what can we do about this. This then triggers dialogue, decision-making and action – all driving to better people performance. Data visualizations have the power to change the dynamic in the boardroom. Attractive and informative visualizations of your data can get everyone paying attention, engaged, and finally seeing and understanding your story. From here, you have the basis for collaboration and taking action towards elevated people and business performance. If every picture tells a story, a picture is worth a 1000 words, and seeing is believing… what are you waiting for? You have a compelling people-story to share…it’s time you communicated it in a way that engages, excites, and motivates the business to action. Go ahead. Unlock the potential of your data, your team, your company… and you!